Unauthorised Access Was 39.5%. Its Entry Point Was Identified In 5.2% Of Cases.
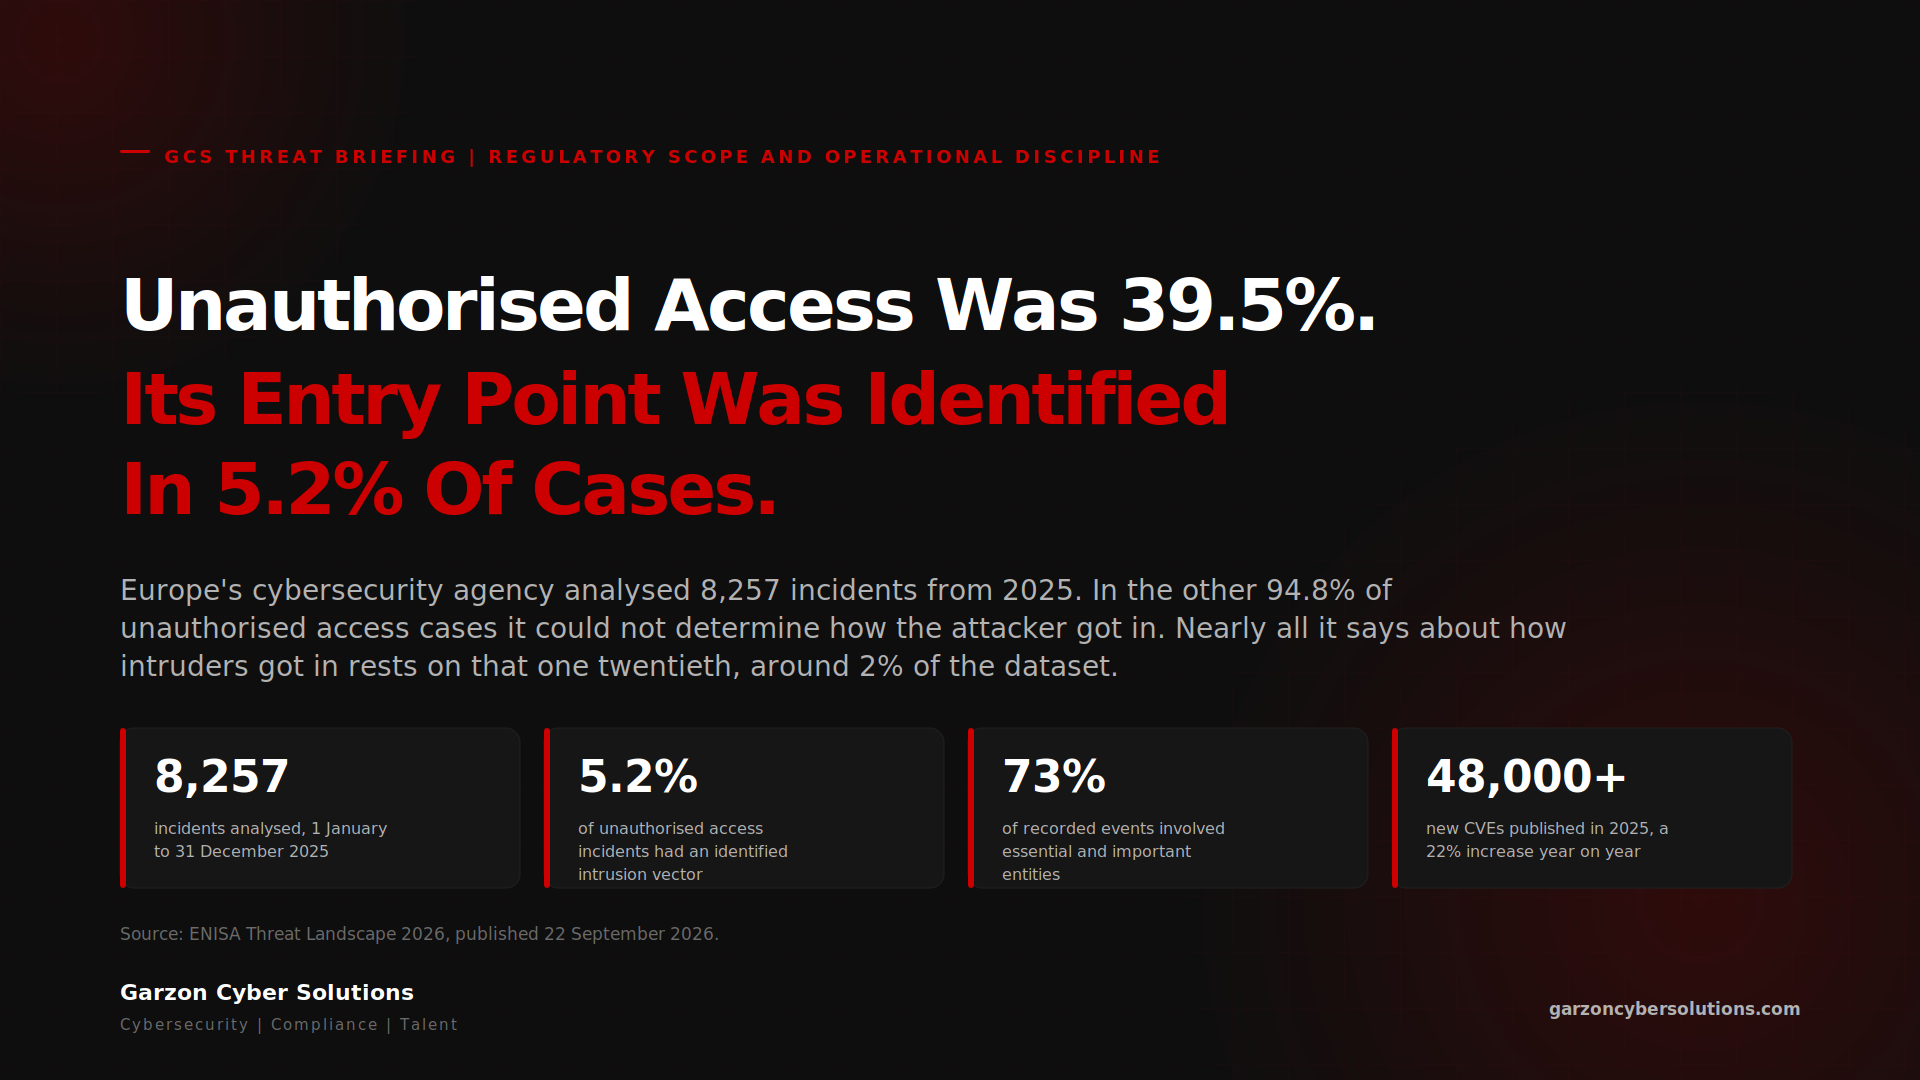
On 22 September the European Union Agency for Cybersecurity published its Threat Landscape 2026, analysing 8,257 incidents recorded between 1 January and 31 December 2025. The figure being quoted from it is 73%, the share of recorded events involving essential and important entities as the NIS2 Directive defines them. That number is softer than it looks. The one nobody is quoting sits seven pages earlier, in the overview chapter, and it is 5.2%.
Unauthorised access accounts for 39.5% of recorded activity. Our reading is that this is where the damage sits, and ENISA's own data supports it: the category is dominated by financially motivated activity at 63.9%, and ENISA assesses financially motivated activity as the most impactful in the short term. It was able to identify an intrusion vector in 5.2% of those incidents. In the remaining 94.8%, it could not determine how the attacker got in. Nearly everything the report says about how intruders got in, including the widely repeated finding that 60.4% of identified vectors involved a vulnerability, rests on that one twentieth of unauthorised access incidents, around 2% of the dataset.
There are two readings of that gap and the report supports both. ENISA's own methodology cautions that open sources and voluntarily shared information do not constitute a complete picture, and names reporting granularity as an inherent limitation, so part of the 94.8% is certainly what victims and the press never disclosed rather than what victims could not determine. The other reading is that forensic readiness is thin enough that, in most intrusions, no account of the entry point existed to disclose. We cannot separate the two from this data. We lead with the second because it is the one a board can act on, and because the first offers no comfort: an organisation that could establish an entry point but has never had to is in the same position as one that could not.
What happened
- 1 January to 31 December 2025The reporting period. Every figure in this briefing describes calendar year 2025, not the present quarter. ENISA collected and analysed 8,257 incidents over those twelve months, drawing on open sources, anonymised information supplied by member states and contributions from members of its Cyber Partnership Programme.
- 22 September 2026ENISA publishes the Threat Landscape 2026. By activity type, DDoS attacks account for 51.3% of recorded activity and unauthorised access for 39.5%. By motivation, ideology-driven incidents make up 57.3% of activity targeting or impacting the EU, with financially motivated operations at 29.2%; ENISA assesses the latter as the most impactful in the short term. Public administration is the most affected sector at 31.8%, ahead of business services at 8.5%, transport at 8%, manufacturing at 6.9% and finance and banking at 5.6%. Essential and important entities represent 73% of total recorded events. ENISA recorded 4,709 hacktivist claims against EU member states during the year, more than 89% of which involved DDoS.
- The overview and vulnerability chaptersMore than 48,000 new vulnerabilities with assigned CVE identifiers were published in 2025, a 22% increase on the previous year. Exploitation of both N-day and 0-day vulnerabilities remains a prevalent intrusion vector. Across unauthorised access incidents for which ENISA was able to identify an intrusion vector, a group representing just 5.2% of that category, 60.4% were recorded as exploiting a vulnerability.
- The overview and sectoral chaptersENISA records continued targeting of cyber dependencies, including supply chain and third party attacks, with several examples of large scale or otherwise impactful incidents. In the public administration chapter it gives what it calls a notable example of ransomware disruption: an attack against a Swedish IT supplier which affected around 200 municipalities and regional authorities and disrupted systems used for HR reporting. ENISA's Executive Director, Juhan Lepassaar, frames the year in one sentence: the analysis highlights how threats become more interconnected and how threat groups spread their impact across the larger map of digital services and infrastructures.
Why this one is different
Annual threat reports are read for the top line and filed. The commercially useful material in this one sits in three places, and the headline number is not among them.
An organisation that cannot establish an entry point cannot answer four commercial questions. It cannot tell a regulator what was affected. It cannot tell a customer whether their data moved. It cannot make a clean insurance claim. And it cannot demonstrate that the same route has been closed. Those are four separate exposures, and every one of them is decided by logging and retention choices taken long before the incident, usually on cost grounds, usually by somebody who was not asked to weigh them against a notification clock. A 5.2% identification rate across a continent is consistent with those choices being made wrong at scale.
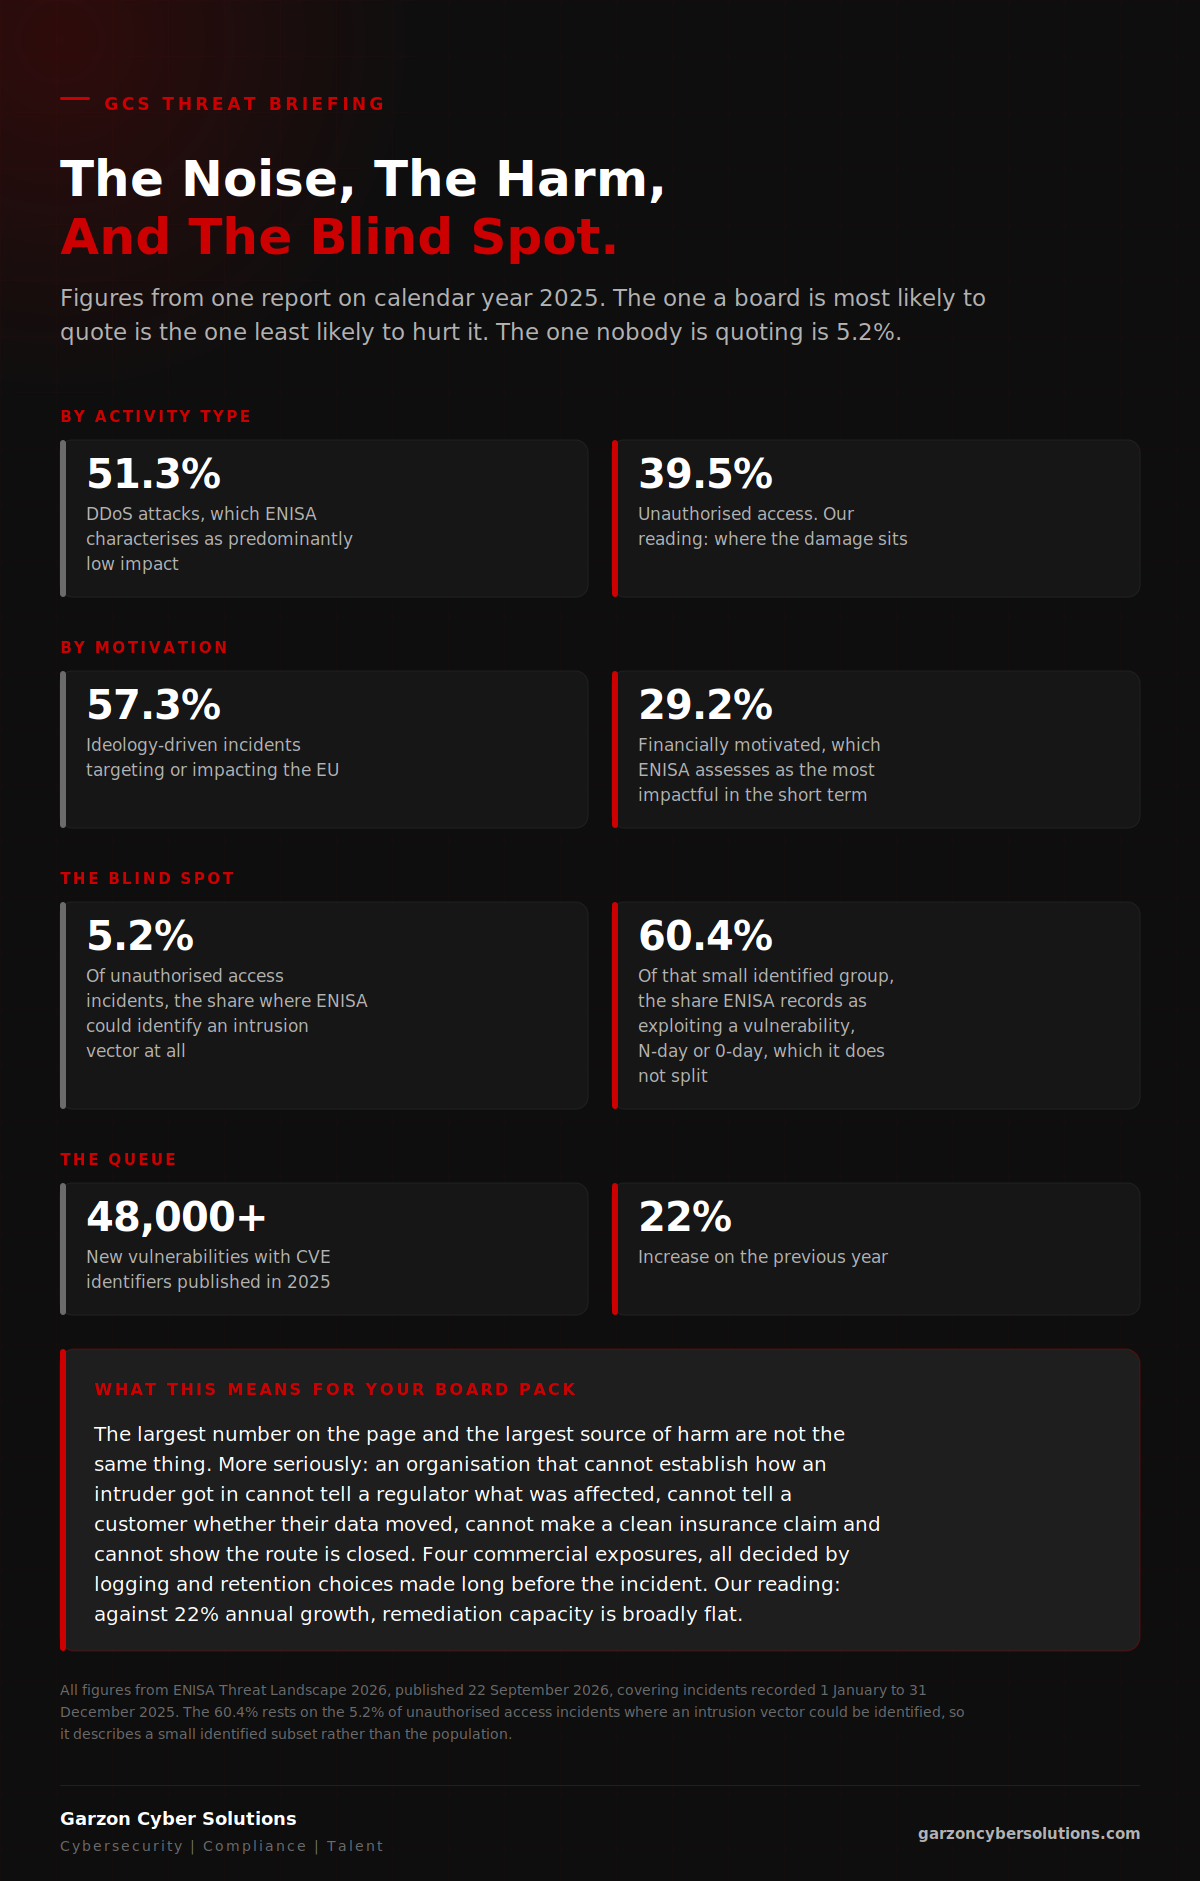
The two most quotable numbers both mislead, in opposite directions. Read the sector table as a board normally reads it and the conclusion is comfortable. Public administration takes 31.8%. Business services takes 8.5%. Transport takes 8%. Manufacturing takes 6.9%. Finance and banking takes 5.6%. A manufacturing board sees 6.9%, notes that the public sector is bearing the weight, and moves on. Read the regulatory line instead and the conclusion inverts: 73% of recorded events involved essential and important entities, a classification cutting across most of the sectors in that table, though ENISA notes its recorded events also include non-NIS2 sectors. Both readings are wrong on their own. The sector table understates how far the regulated perimeter reaches. The 73% overstates the harm inside it, because a large part of its volume is hacktivist denial of service against public bodies. Neither number survives contact with the question a board actually needs answered, which is not how many incidents there were but which ones cost anybody anything.
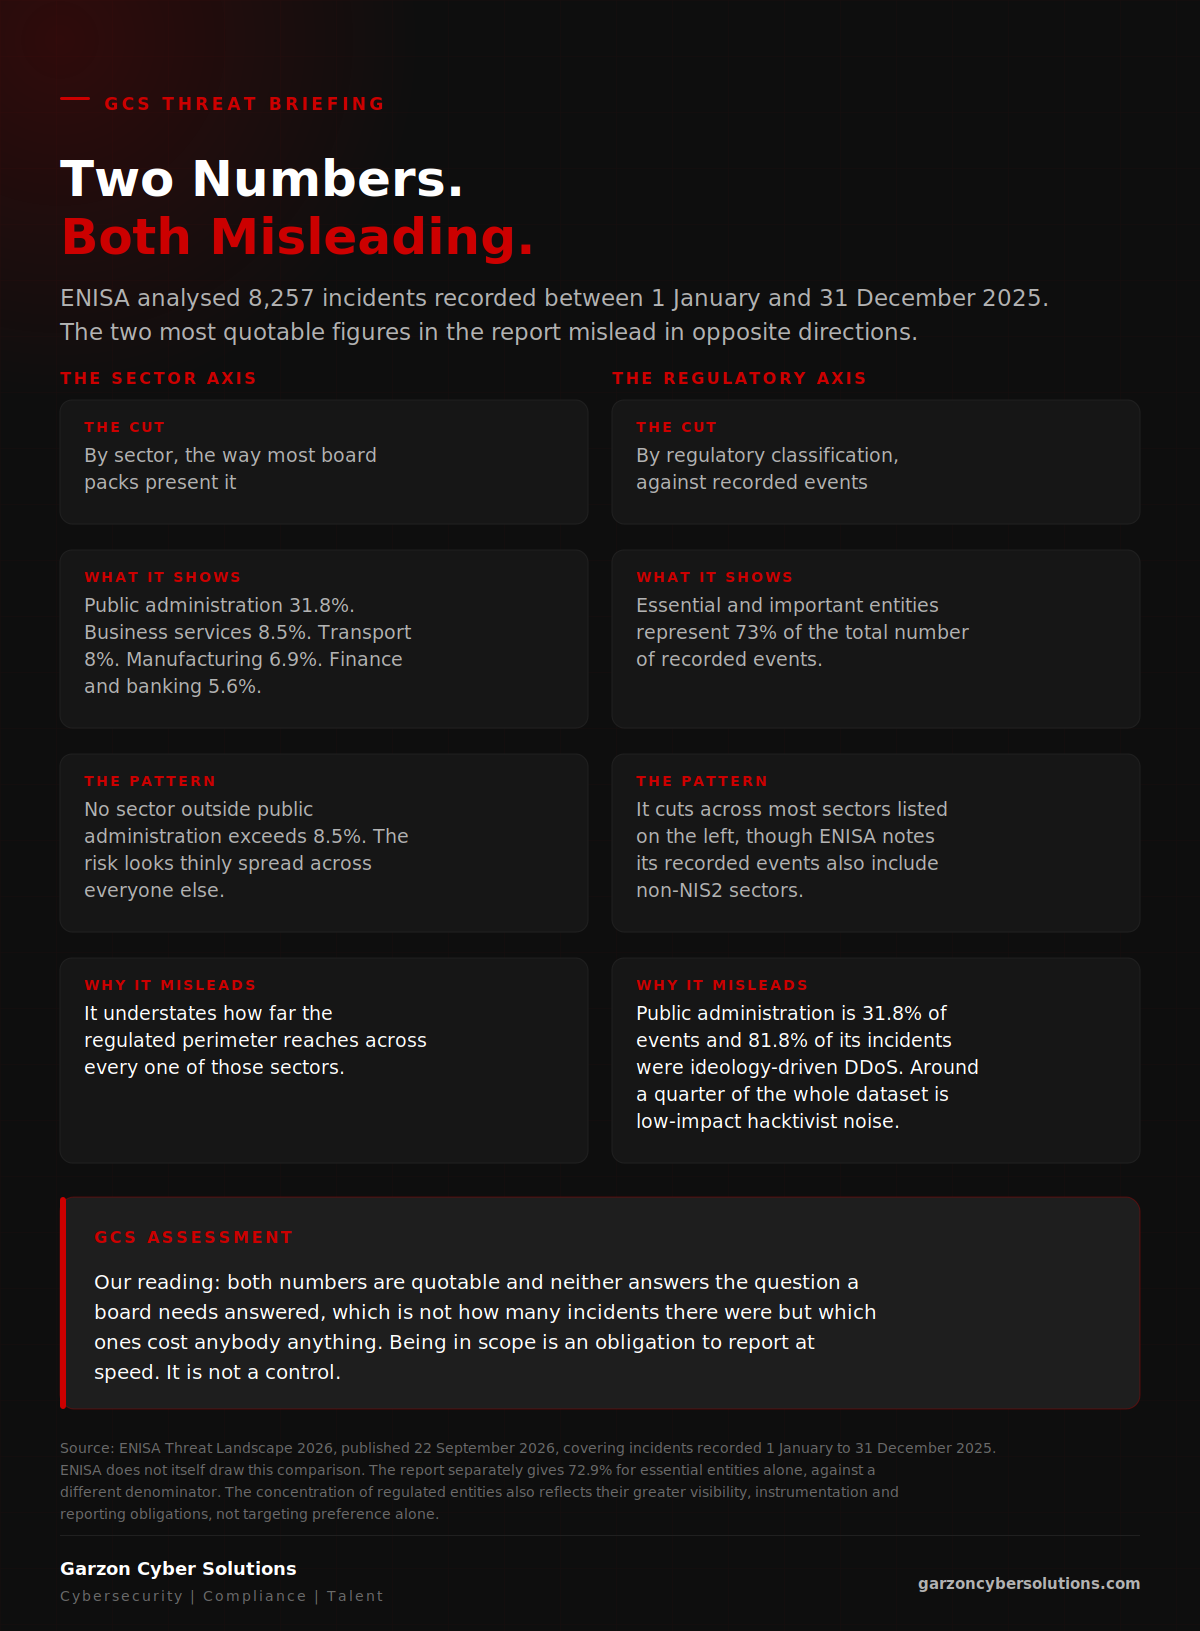
The queue is growing faster than anyone is working it. More than 48,000 new vulnerabilities with CVE identifiers were published in 2025, a 22% increase year on year, and ENISA records exploitation of both N-day and 0-day vulnerabilities as a prevalent intrusion vector. The report does not split the 60.4% between the two, so we cannot tell you what share was addressable by patching alone, and we will not pretend otherwise. What we can say commercially is that a 22% annual increase in published vulnerabilities against a flat remediation capacity is a widening gap, and that the organisations which handle it will be the ones that triage by exposure rather than by severity score.
The commercial exposure for UK organisations
The obvious objection is jurisdictional. Essential and important entities are EU legal categories and the United Kingdom sits outside the EU's territorial scope for most sectors. There are four reasons a UK board should read the report anyway, and only the first is regulatory.
Regulatory. The Cyber Security and Resilience Bill, which completed Lords Grand Committee on 7 September and is awaiting Lords report stage on 26 October, widens the existing UK regime to managed service providers and data centres, creates a power to designate critical suppliers, and shortens incident notification to an initial 24 hours with a fuller report at 72. It is narrower than NIS2 and it does not adopt the essential and important entity classification, so we are not going to tell you it is the same perimeter. It moves UK obligations in the same direction, and for the organisations it captures the practical effect is the one that matters: a duty to produce an account of an incident on a clock shorter than most incident response functions currently run to.
Direct EU reach, for some of you. The flat statement that NIS2 does not touch UK firms is wrong, and it is worth correcting because it is wrong precisely for the organisations most likely to be reading this. NIS2 reaches beyond the EU's borders. Non-EU providers of DNS, cloud computing, data centre, content delivery, managed and managed security services, among others, that are in scope in the first place, broadly medium-sized and larger, and that offer services in the Union, must designate a representative in a member state where they offer those services, and are then treated as falling under that member state's jurisdiction. If you are a UK MSP, MSSP or cloud provider of that size serving European customers, you may be directly in scope rather than merely contractually exposed. That is a question for your counsel this quarter, not next year.
Contractual. For everyone else the exposure arrives through customers rather than regulators, and it moves faster than legislation. An in-scope European customer that must demonstrate supply chain security management does so by pushing requirements down its contracts: a supplier questionnaire that asks for evidence rather than policy, and notification terms tightened to the customer's clock rather than yours. If you sell to a regulated European buyer, you are already in scope commercially whatever your legal position.
Financial. ENISA's public administration chapter gives a ransomware attack on a Swedish IT supplier that reached around 200 municipalities and regional authorities and disrupted systems used for HR reporting. Our own reading, and not ENISA's, is that the instructive part is the asymmetry: the costs that land are rarely the penalty against the supplier. They are the notification programme, the legal and forensic spend, the cost of running a function while its system is unavailable, and the revenue deferred while a customer's security team re-approves you. Those are absorbed downstream by organisations that did nothing wrong and recover nothing.
What leaders should do now
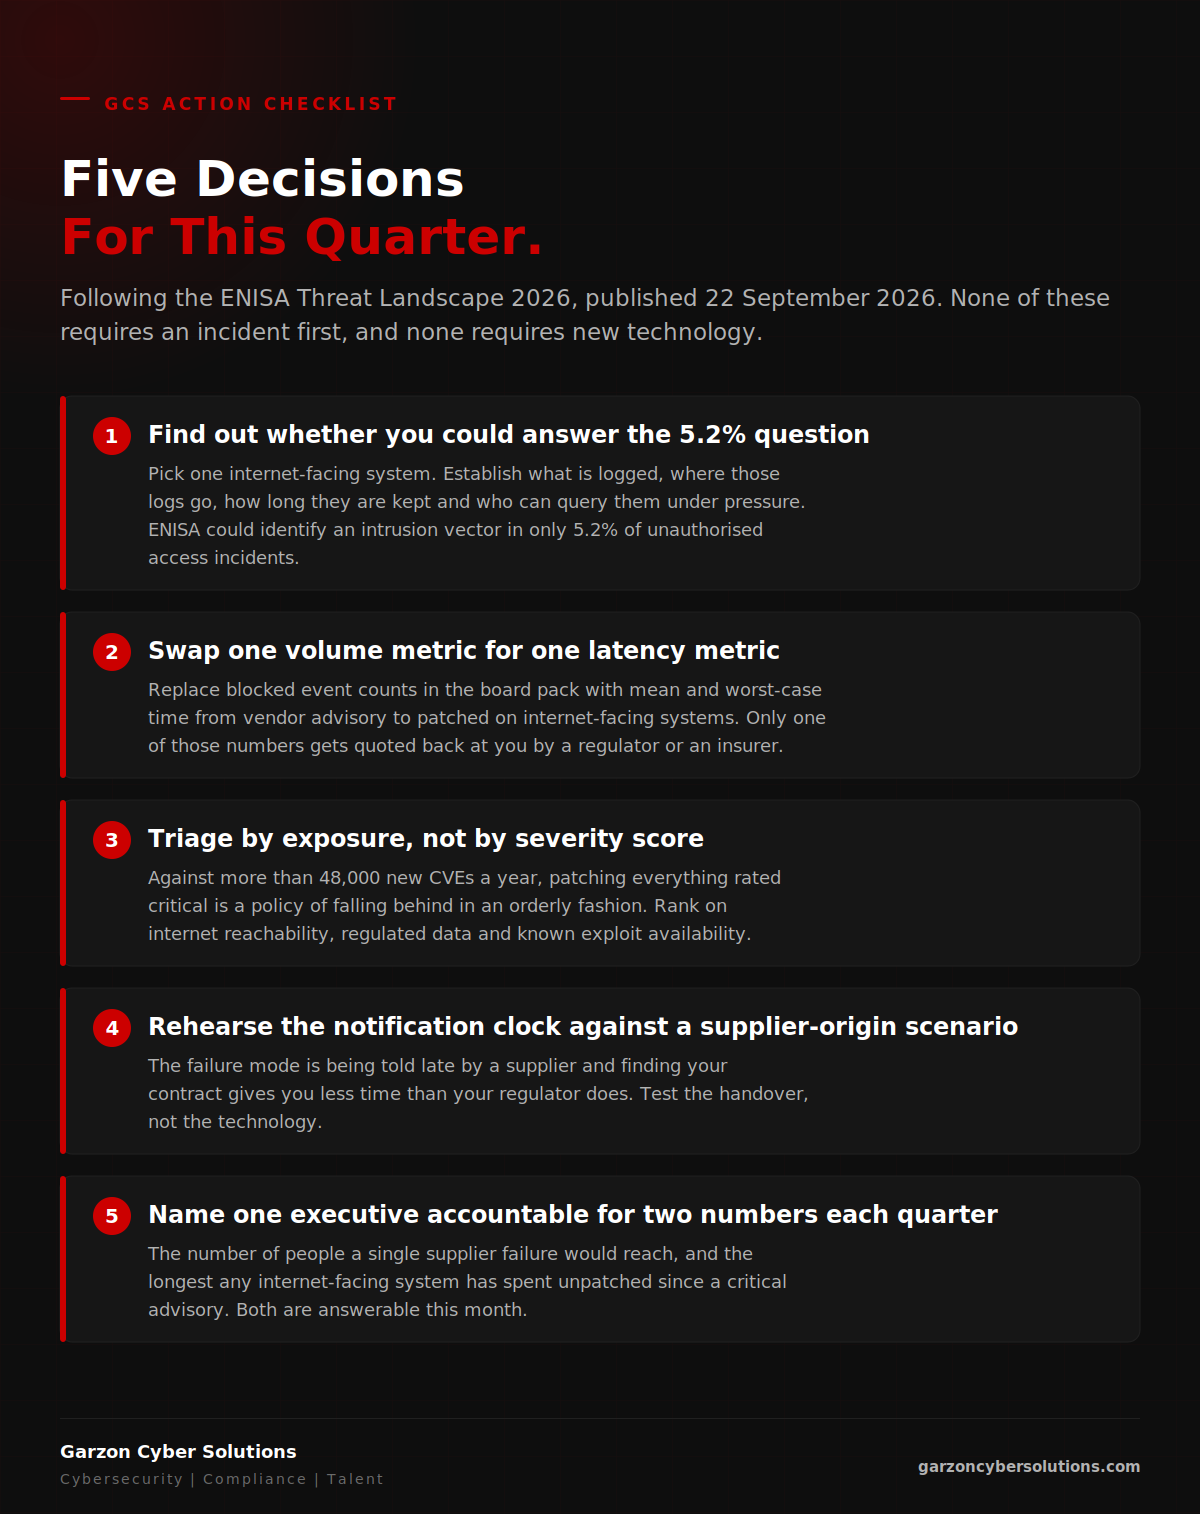
- Find out whether you could answer the 5.2% question. Pick one internet-facing system and ask what evidence would survive to establish an intrusion vector in it: what is logged, where those logs go, how long they are kept, and who can query them under pressure. Most organisations discover the answer is 30 days of something nobody has ever queried. It is among the cheapest gaps to close and it decides how every subsequent conversation with a regulator, an insurer or a customer goes.
- Swap one volume metric in the board pack for one latency metric. Blocked event counts tell the board how busy the tooling is. Mean and worst-case time from vendor advisory to patched on internet-facing systems tells the board how it is placed against a vulnerability queue growing at 22% a year. Only one of those numbers gets quoted back at you by a regulator or an insurer.
- Triage by exposure, not by severity score. Against more than 48,000 new CVEs a year, a policy of patching everything rated critical is a policy of falling behind in an orderly fashion. Rank by whether the asset is reachable from the internet, whether it holds regulated data, and whether a known exploit exists. That ordering is different from your scanner's, and it is defensible to a board.
- Rehearse the notification clock against a supplier-origin scenario. The failure mode is being told late by a supplier and finding your contract gives you less time than your regulator does. Test the handover, not the technology, and do it before the 24 hour expectation lands.
- Name one executive accountable for two numbers each quarter. The number of people a single supplier failure would reach, and the longest any internet-facing system has spent unpatched since a critical advisory. Both are answerable this month. Neither requires an incident first.
Three questions for the board
- If we were breached last night, could we establish how, and what specifically would we produce to show it? If the answer depends on logs, how long do we keep them and has anyone ever queried them in anger?
- Of the security numbers in our quarterly pack, which would a regulator, an insurer or an enterprise customer actually ask for, and which are there because they are easy to collect?
- If a supplier told us today they were breached three weeks ago, what is the gap between the notice our contract entitles us to and the notice our regulator expects from us, and who owns closing it?
The strategic takeaway
The instinct on receiving an annual threat report is to look for what is new. The commercially useful finding in this one is how little is, and how poorly the rest is understood. Hacktivist denial of service inflating a headline number. Known and unknown vulnerabilities running through a queue growing at 22% a year. Impact travelling through shared dependencies into organisations that were already regulated. And underneath all of it, an evidential gap so wide that in nineteen of twenty unauthorised access incidents no account of the entry point reached the record.
Nothing there requires a novel defence. All of it requires demonstrable discipline, which is a different purchase entirely and one most organisations have deferred because the benefit was invisible. That is changing, and the change is commercial rather than regulatory. Scope arrives with obligations to evidence, and evidence cannot be produced retrospectively. Organisations that treat the next eighteen months as a compliance exercise will assemble the artefacts late, under pressure, and get no commercial return for the spend. Those that treat it as a sales asset will build the same artefacts once, keep them current, and use them to shorten enterprise security reviews, defend margin in procurement and satisfy an insurer. The cost is close to identical. The return is not.
73% of last year's recorded events landed on organisations ENISA classifies as essential or important under NIS2. That classification tells a regulator where to look. It does not tell anybody how the attacker got in.
Confidence note
Confirmed. From the ENISA Threat Landscape 2026, published 22 September 2026 and covering incidents recorded from 1 January 2025 to 31 December 2025: that ENISA analysts collected and analysed 8,257 incidents; that essential and important entities represent 73% of the total number of recorded events, which ENISA presents as confirming the relevance of the NIS2 approach; that DDoS attacks at 51.3% and unauthorised access at 39.5% continued to account for a large share of recorded activity; that unauthorised access is dominated by financially motivated activity at 63.9%; that activity targeting or impacting the EU mostly pertained to ideology-driven incidents at 57.3%, followed by financially motivated operations at 29.2%; that among social engineering techniques phishing remains a prevalent intrusion vector at 77.8%, followed by malicious spam at 13%; that across unauthorised access incidents for which ENISA was able to identify an intrusion vector, a group representing 5.2% of that category, 60.4% were recorded as exploiting a vulnerability; that exploitation of N-day and 0-day vulnerabilities remains a prevalent intrusion vector; that more than 48,000 new vulnerabilities with assigned CVE identifiers were published in 2025, a 22% increase on the previous year; the sector shares of public administration 31.8%, business services 8.5%, transport 8%, manufacturing 6.9% and finance and banking 5.6%; that within public administration, ideology-driven DDoS accounted for 81.8% of recorded incidents; that ENISA recorded 4,709 hacktivist claims against EU member states, more than 89% involving DDoS; that financially motivated activities remain the most impactful in the short term; and that ENISA describes a notable example of ransomware disruption in the public administration sector as an attack against a Swedish IT supplier which affected around 200 municipalities and regional authorities and disrupted systems used for HR reporting. Our reading of that incident as a dependency cascade is ours, not ENISA's. The Lepassaar quotation is as carried in ENISA's own announcement of the report.
Conflicting in the sources. ENISA's press release and the report text disagree on the composition of financially motivated activity, and they do not even use the same denominator. The press release gives ransomware 40% and data breaches 31% as shares of all analysed events, which cannot be reconciled with its own figure of under 30% for financially motivated activity overall. The report text gives ransomware 47.3%, data breaches 36% and fraud and impersonation 13.3% as shares of recorded financially motivated claims. We have excluded both pending clarification rather than pick one. Separately, the report gives 72.9% for essential entities alone in one chapter and 73% for essential and important entities in another, against different denominators, recorded incidents in the first and recorded events in the second. We have used the 73% figure throughout because it is the one ENISA's own announcement carries and the one tied to the NIS2 definition, and we flag the discrepancy rather than smooth it. The report also gives financially motivated activity as 29.2% in its overview chapter and 29.3% in its executive summary; we use 29.2%.
Assessed. The comparison between the sector axis and the regulatory axis is ours; ENISA does not draw it. Our reading that the 73% partly reflects the greater visibility, instrumentation and reporting obligations of large regulated entities, and that a large part of it is low-impact hacktivist DDoS against public bodies, is an inference from the sector and motivation data rather than an ENISA finding. That inference is approximate: not every public administration body falls automatically inside the NIS2 essential and important classification, though every component figure is confirmed above. Our characterisation of a 5.2% vector identification rate as a forensic readiness problem, and the four commercial consequences we draw from it, are judgements. So are our readings, labelled as such wherever they appear, that unauthorised access is where the damage sits and that remediation capacity is broadly flat against a 22% annual increase in published vulnerabilities; ENISA publishes no remediation capacity measure. The asymmetry argument about downstream cost in the cascade example is ours and not ENISA's; ENISA makes no statement about any penalty. Our account of the Cyber Security and Resilience Bill follows published summaries rather than the Bill text, and its parliamentary timetable can move. Our summary of NIS2's extraterritorial reach reflects the Directive's provisions on non-EU providers and the requirement to designate an EU representative; whether any particular UK firm is captured is a question for counsel. None of this is legal advice.
Not known. Whether the 94.8% reflects victims' inability to establish an entry point or simply the granularity of public reporting. ENISA's methodology expressly caveats that open sources do not constitute a complete picture and names reporting granularity as an inherent limitation. Our forensic readiness reading is the commercially actionable one, not the only one. Whether the 73% share is rising or falling on a like-for-like basis. ENISA's 2025 report covered a different twelve month window, 1 July 2024 to 30 June 2025, recorded 4,875 incidents, and drew on a partly different source base with an expanded set of tracked activities, so we have deliberately not computed a year on year change from the two headline counts; any such comparison would be measuring methodology as much as threat. We also do not know the split of the 60.4% between N-day and 0-day exploitation, which is what would tell a board how much of that exposure patch latency actually addresses, nor the sector composition within the essential and important classification.
If you were breached last night, could you establish how?
Garzon Cyber Solutions was built around the argument that security, compliance and the people who sustain them are one capability rather than three cost lines. A forensic readiness baseline, a patch latency metric and supplier evidence that survives a shortened notification clock are the same artefacts enterprise buyers, insurers and acquirers ask for. If your leadership team needs those built once, kept current and owned by someone named, start the conversation.
Start the Conversation →Every figure in this briefing comes from the two ENISA items below. The remaining links are coverage.
ENISA, "ENISA Threat Landscape 2026", published 22 September 2026 · ENISA, "ENISA Threat Landscape 2026" (full report, PDF), September 2026 · ENISA, "Exploring the evolution of the cyber threat landscape: how dependencies weaken our digital resilience", 22 September 2026 · Help Net Security, "Europe's technology backbone is becoming a cyber target", 24 September 2026 · Industrial Cyber, "ENISA Threat Landscape 2026 highlights ransomware, vulnerability exploitation, AI-enabled attacks across EU organizations", September 2026 · UK Parliament, "Cyber Security and Resilience (Network and Information Systems) Bill: Stages"
Garzon Cyber Solutions delivers cybersecurity advisory, compliance certification and specialist technology recruitment as one integrated capability for organisations in the UK, EU and Americas. We are a young firm and we publish our own research. Founder Jonathan Garzon spent his career selling cybersecurity, compliance and technology to security and technology buyers, working alongside marketing and technical colleagues, before building GCS around a single argument: delivered in the right order, security, compliance and the people to sustain them stop being three cost lines and become one commercial capability.